Category: Tag Clouds


New Books: ‘Tagging’ and ‘Mental Models’

March 12th, 2008 — 12:00am

If you’re interested in tagging and social metadata, social bookmarking, or information management, be sure to check out Gene Smith’s Tagging: People-Powered Metadata for the Social Web recently published by from New Riders. I reviewed some of the early drafts of the book, and it’s come together very nicely.
tagging_cover.jpg
Tagging takes a very practical approach, and provides an ample set of examples in support of the insightful analysis. After an overview of tagging and its value, the book addresses tagging system design, tags in relation to traditional metadata and classification systems, and covers the user experience of creating and navigating tag clouds.

Gene likes to build things, so Tagging includes a chapter on technical design complete with suggested tools and tutorials for creating your own tagging apps.

All in all, Tagging is a worthy introduction to the subject, and a guide for deeper exploration.
While we’re talking books, kudos to Rosenfeld Media on the publication of their first book, Mental Models; Aligning Design Strategy with Human Behavior, by the very talented Indi Young!
mental-models-lg.gif
Mental Models is richly illustrated, filled with examples, lucid, and accompanied by a considerable amount of additional content from the Rosenfeld Media website.

Indi has considerable experience teaching others the techniques and methods behind creating insightful mental models for audiences and customers. Cognitive / frameworky methods can feel a bit heady at times (especially how-to’s on those methods), but Mental Models is straightforward reading throughout, and an eminently practical guide to using this important tool for user experience design and strategy.

Mental Models is available electronically as a .pdf for individual and group licenses, or in hard copy; it’s choose your own medium in action.

Comment » | Reading Room, Tag Clouds, User Experience (UX), User Research

Joining the Tag Team At Tagsonomy.com

July 22nd, 2007 — 12:00am

I’ll be writing about tagging, tag clouds, folksonomies, and related topics over at Tagsonomy.com going forward. As Christian Crumlish observed, it’s been quite at Tagsonomy.com for a while, but that doesn’t mean that tagging is anywhere close to being fully figured out.

To help kickstart the conversation, I’ve put up two posts since officially joining the Tag Team; The Tagging Hype Cycle, and Is Tagging a Disruptive Innovation?.

Comments are already flowing in – be sure to join the discussion.

Comment » | Tag Clouds

Watching Ideas Bloom: Text Clouds of the Republican Debate At Democrats.org

May 4th, 2007 — 12:00am

A meme is emerging for the use text clouds as visualization for – and a source of insight into – political speeches and speakers.
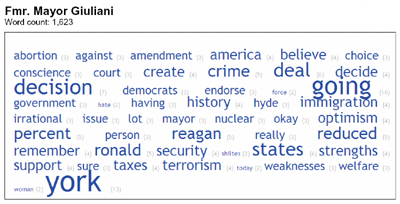
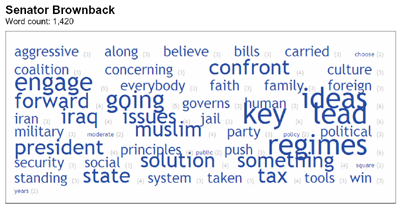
Text clouds of the Republican Presidential candidates’ debate appear front and center on the DNC blog democrats.org, in Tag Clouds Can Tell Us a Lot…. (sourced from media analysis firm Upstream Analysis via Pollster.com).
GiulianiTag400.png
BrownbackTag400.png
As you can see in the quote from the writeup below, we’re quickly developing sophisticated readings of the (comparatively) simple visualization methods used to generate text clouds.

But sometimes a cloud also reflects concerns that voters share about a candidate. This is because the candidate gets asked about the issue–a lot–and then has to talk about it.

Check out the large “Pro-Life” tag in flip-flopping Romney’s cloud, or the large “Think” tag in Giuliani’s cloud–the candidate notorious for leaping first and thinking later.

Political interpretations aside, this is a nuanced reading of the resulting clouds: it recognizes the dynamic feedback link between intentions and responses that becomes visible in the rendered clouds. For a visualization geek, these clouds show the differing agendas of candidates and audience as they played out, a nice example of social mechanisms in action.

Note to the tool builders of the world

How about putting together a visualization toolset that shows evolving text clouds as the debate progresses? I’m imagining a timeline plus transcript plus cloud view of the accumulating text cloud for each candidate, with options for moving forward or back in the stream of words.

What could be better than watching words and ideas bloom over time, the same way we see flowers in a garden blossom, open, and close in time lapse photography. I’d like to think we can grow something poetic and beautiful, as well as useful, from the (sadly debased) soil of politicized sound bites surrounding us.

Or, with a nod to the brutal competition built into most natural systems, you may choose to watch the struggle of waterlillies for sunlight, in this clip from The Amazing Life of Plants.

Comment » | Tag Clouds

Text Clouds of the Democratic Debate

April 28th, 2007 — 12:00am

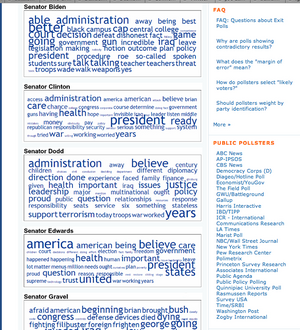
Mark Blumenthal, of Pollster.com, recently posted a set of text clouds showing the words used by each candidate in the Democratic presidential debate Thursday night. The clouds were generated from transcripts of the debate, using Daniel Steinbock’s Tag Crowd tool.

Candidates’ Text Clouds

In the screenshot of Mark’s posting, it’s easy to see this is a great example of a collection of text clouds used for comparative visualization and interpretation. The goal is to enhance understanding of the meaning and content of the candidate’s overall conversations during the debate, an idea I explored briefly last year.

Just a month ago, in a post that identified text clouds as a new and distinct tag cloud variant, I suggested:

text clouds may become a generally applied tool for managing growing information overload by using automated synthesis and summarization. In the information saturated future (or the information saturated present), text clouds are the common executive summary on steroids

Supporting the comparison and interpretation of political speeches is an inventive, timely, and resourceful application that could make text clouds a regular part of the new personal and professional toolkit for effectively handling the torrents of information overwhelming people in important situations like vetting political candidates.

I especially like the way this use of text clouds helps neatly sidestep the disheartening ubiquity of the soundbite, by aggregating, distilling, and summarizing all the things the candidates said. I suspect few – if any – of the campaigns realize the potential for text clouds, but they definitely know the detrimental power of soundbites:

“It’s a mess,” said an exasperated-sounding Mr. Prince, Mr. Edwards’s deputy campaign manager. “Debates are important, but in these big multicandidate races they end up not being an exchange of ideas, but just an exchange of sound bites. They have become a distraction.”

From Debates Losing a Bit of Luster in a Big Field

The value of a collection of soundbites over an insightful dialog is – apologies for the pun – debatable. But even if a simple exchange of soundbites is what the new shortened formats of many debates yields us, text clouds may help derive some value and insight from the results. The combined deconstructive and reconstructive approach that text clouds employ should make it possible to balance the weight of single remarks of candidates by placing them in a larger and more useful context.

History Repeats Itself

In the longer term view of the history of our responses to the problems of information overload, the appearance of text clouds may mark the emergence of a new general puprose tool for visualizing ever greater quantities of information to support some qualitatively beneficial end (like picking a good candidate for President, which we sorely need).

The underlying pattern – a consistent oscillation between managing effectively and ineffectively coping, depending on the balance between information quantity and tool quality – remains the same. Yet there is also value in knowing the cycles that shape our experience of handling the information crucial to making decisions, especially decisions as important as who leads the country.

The NY Times transcript of the debate is available here.

Comment » | Tag Clouds

Text Clouds and Advertising: Microsoft’s Community Buzz Project

April 28th, 2007 — 12:00am

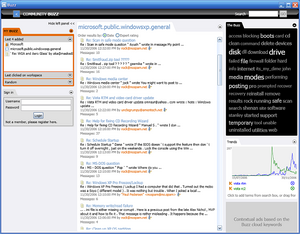
Thanks to Datamining, for posting a writeup and screenshot of a prototype of Community Buzz, which features a text cloud. Community Buzz is a Microsoft Research project, and this is a perfect use of a text cloud to visualize concepts and further comprehension in a body of text.

More interesting than the text cloud is the space in the screenshot that looks like a placeholder for advertising driven by the contents of the text cloud. The annotation reads “Contextual ads based on the Buzz cloud keywords”, implying an advertising based revenue mechanism driven by creation and analysis of a text cloud.

Community Buzz Screenshot

The description of Community Buzz posted on the TechFest 2007 page, includes the following, making the connection to an advertising model explicit:

Community Buzz combines text mining, social accounting (Netscan/MSR-Halo), and new visualization techniques to study and present the content of communication threads in online discussion groups. The merging of these research technologies results in a system that gives great value to community participants, enables highly directed advertising, and supplies rich metrics to product managers.

Assuming it’s possible to provide highly directed advertising and rich metrics based on text clouds, I can see the benefits of for advertisers and product managers, and researchers of many kinds. Yet I’m not convinced of the benefits for community participants. Where will the text clouds come from, and how will their content reflect the needs of the community? How will social dynamics shape or affect these text clouds, to make it possible for them to leverage network effects, differential participation, and the scale benefits of connected social systems?

Text clouds – at least at this stage of development – support rapid but shallow comprehension: maybe this is perfect for advertising purposes…

Like a pile of dry bones that used to make up a skeleton, text clouds lack the specific structure and context of their source, and so cannot replace comprehension. Text clouds deconstruct the word elements that make up a body of text the same way spectrum analysis identifies the different wavelengths of light from a distant star. It’s a bit like using statistical analysis to read King Lear, instead of using a variety of tools to learn more about what Lear might have to say.

A better use of text clouds, or any other type of deconstructive method (a variant of semiotics) is as a tool for enhancing comprehension. Text clouds seem to bypass distinctions between high context and low context that present barriers to understanding deep context, by focusing on the raw content of the source, on the level of it’s constituent elements.

The goal of examining the fundamental or essential makeup of something we’re exploring – as a way of better understanding that thing overall – is an epistemological method pursued by Plato and a host of other Western philosophers and natural scientists. We should be cautious with new tools, however, as the urge to illuminate and dissect the fundamental makeup of that which is complex and nuanced can go too far, crossing from the insightful to the sterile domain of soulless reductivism. Witness the responses of corrupt officials to Javier Bardem’s character Agustín, in John Malkovich’s directorial debut The Dancer Upstairs.
Agustín is a police hero who saves his country from a criminal and oppressive government, social disintegration, and guerilla takeover. He then surrenders all prospects of winning the presidency and leading his struggling nation to prosperity for the unrequited love of a woman who aided the same guerilla leader he helped capture. Agustín strikes a secret bargain to secure her freedom with the corrupt powers that be, on condition that he withdraw from public life. His choice is incomprehensible to the soulless officials in power. To these people, who buy, sell, and execute hundreds without a thought, Agustín’s lover “…is just a girl – 70% water.”

For reference, the overview of Community Buzz:

  • Community Buzz combines analysis of the content of online discussions and social structure of the communities to identify hot topics and visualize how they evolve over time.
  • Through search and Buzz cloud users can access relevant discussion threads and adverts linked to the search results and Buzz keywords.
  • Visualization of keyword trends enables the users to monitor the popularity of selected topics. Mesasages can be filtered based on the ‘social status’ of the author in the community.

And the complete description of the demo mentioned by Datamining:

Community Buzz is a new window into online communities! Interesting and useful conversations, authors, and groups are discovered easily using this tool, jointly developed by Microsoft Research Redmond’s Community Technologies group and Microsoft Research Cambridge’s Integrated Systems team, with sponsorship from Live Labs. Community Buzz combines text mining, social accounting (Netscan/MSR-Halo), and new visualization techniques to study and present the content of communication threads in online discussion groups. The merging of these research technologies results in a system that gives great value to community participants, enables highly directed advertising, and supplies rich metrics to product managers.

Comment » | Tag Clouds

Text Clouds: A New Form of Tag Cloud?

March 15th, 2007 — 12:00am

During 2006, tag clouds moved beyond their well-known role as navigation mechanisms and indicators of activity within social media experiences, emerging as a standard visualization technique for texts and textual data in general.

This use of tag clouds does not commonly involve tags, social networks, emergent architectures, folksonomies, or metadata.
“Text cloud” might be a more accurate label for these visualizations than tag cloud. In addition to recognizing fundamental differences – text clouds differ from tag clouds in composition (no tags at all) and purpose (predominantly comprehension, rather than access or navigation) – distinguishing the two types of clouds will make it much easier to assess their abilities to support user experience needs and business goals.

The emergence of this new form of text cloud looks like a good example of speciation in action (though it’s too early to tell whether the end result will be cladogenesis or anagenesis).

Major and minor publications feature(d) text clouds as visualizations in 2006, both permanently and temporarily:

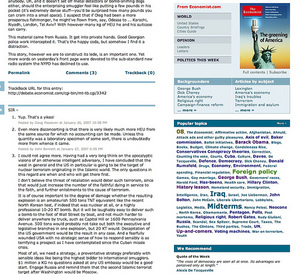
The Economist’s Text cloud

In 2006, several free and public tools for generating text clouds locally on the desktop or via a service available through the Web were released.  The increase in the number and variety of specific text cloud tools reflects embrace and enthusiasm for text clouds in communities of interest for information visualization, language processing, and semantics.

Some of the better known examples of text cloud tools include:

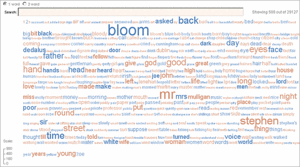
The Many Eyes Cloud

The text clouds created with these tools range across a wide spectrum of speeches and writing:

Text clouds are meant to facilitate rapid understanding and comprehension of a body of words, links, phrases, etc. Any block of information composed of text is open to analysis as a text cloud, as these screen captures of text clouds for restaurant menus, ingredients, wikipedia, magazine covers, and even poems demonstrate.
Tim O’Reilly uses text clouds for a number of purposes:

We used them a bunch to analyze the topics, companies and people at the last FOO Camp, and they were the most useful of the visualizations we did. They helped us see where we were under- and over-represented in terms of companies and particular technologies we were wanting to explore. …So they have many uses beyond just showing what we normally think of as tags.

Non-linear Access

The emergence of text clouds shows continuing exploration and refinement of cloud style displays as a new form of user interface, adapted to specific contexts. Continued refinement of text clouds in this direction may indicate an expanding role for commonly available and sophisticated text visualization tools to support specialized goals for information display and understanding.

Remember that Google is busy right now scanning thousands of books per day from several of the world’s major academic libraries, as part of it’s self-appointed labor of organizing the world’s information. That’s a lot of new text. How will people work with effectively with such an overwhelming amount of text, of so many different kinds, from so many different sources?

Consider the following, from Ulysses’ Without Guilt by Stacy Schiff (in the New York Times):
Recently Cathleen Black, president of Hearst Magazines, urged a group of publishing executives to think of their audience as consumers rather than readers. She’s onto something: arguably the very definition of reading has changed. So Google asserts in defending its right to scan copyrighted materials. The process of digitizing books transforms them, the company contends, into something else; our engagement with a text is different when we call it up online. We are no longer reading. We’re searching – a function that conveniently did not exist when the concept of copyright was established.

On a larger scale, the growing use of text clouds hints at a (potential) deeper cultural shift in the way we go about reading and comprehension: a shift from linear modes based on reading words and sentences, to nonlinear modes based on viewing summaries of content in aggregate as a way of discovering concepts and patterns. (Finally, a legitimate use for Twitter…) Experimenting with text clouds for non-linear reading and comprehension (now that’s a sexy term…) is a natural evolution of the role cloud style displays play as an alternative / compliment / supplement to the list based navigation now dominant in user experiences.

A Text Cloud of Twitter Posts (A TwitterCloud?)

ago applied assuming bad briela classes clean coke decompressing dhowell dinner drinkin eisenbear full ga god guy half happy house ibterri impressing issues jedi joanna knows less lhalff lost minute moment nybble ohhhhh rfk rum ryanjames scholarship seconds sites skiing status summer twitterrific txt tyguy umpteenth vlu77 watched water web created at TagCrowd.com

I’m not predicting the end of reading as we know it, nor the end of navigation as we know it: both will be with us for a long, long time. But I do believe that text clouds might constitute an emerging method for augmenting comprehension and display of text, with broad potential uses.

Enterprising Clouds

What about someone lacking time to fully read a Shakespeare play, or a faddish business book, but who needs to understand something about that book’s meaning and substance? A text cloud creation tool could extract the most commonly mentioned terms, and otherwise profile the words that make up the text. It would be risky to rely on a shallow text cloud (and Tim O’Reilly mentions this specifically) for deep comprehension, but it would be enough to understand the concepts that appear, and allow polite conversation at a networking event, or lunch with that certain manager who recommended the book.

If I were entrepreneurial, I’d source a set of free electronic versions of classic texts, process them with one of the free text cloud tools, apply some XSLT and other transformations to generate consistent readable formatting, and sell the results as a line of ebooks called “Cloud Notes”. Of course, someone’s beaten me to it already

What’s in store for the future?

In this fashion, text clouds may become a generally applied tool for managing growing information overload by using automated synthesis and summarization. In the information saturated future (or the information saturated present), text clouds are the common executive summary on steroids and acid simultaneously; assembled with muscular syntactical and semantic processing, and fed to reading-fatigued post-literates as swirling blobs of giant words in wild colors, it consists of signifiers for reified concepts that tweak the eye-brain-language conduit directly.

Comment » | Tag Clouds

2.3% Of Chinese Internet Users Tag, Baidu Reports

March 4th, 2007 — 12:00am

A posting from China Web2.0 Review shared results of a report on Chinese tagging rates released by Baidu, China’s leading search engine.

I was not able to locate a translation of the original report from Baidu, so I’ll quote the summary from China Web2.0 Review:

According to the report, only 2.3% of internet users have ever used tag, they mainly use tags in social bookmarking and blogs. I don’t know the methods of data collection, but the report said about 15 million Chinese webpages were bookmarked by users, on average each user has saved 40 online bookmarks. Among them, over 90% users add less than two tags for a bookmark.

And based on the tags of user saved bookmarks, the most used tags are “software download”, “BBS”, “entertainment”, “game” and “learning”.

We don’t know which services are included for analysis in the report, so I have no idea to which extent I can trust it. But based on my observation, I agree with the basic finding of the report, even though more and more services have embodied tagging feature, only a very small part of early-adopters in China indeed use it.

Two things come to mind right away:

Still, even with the absence of solid qualifying, corroborating, or contextual information, this rate of adoption for tagging seems consistent with the rest of the very rapid pace of modernization in China.

And as the First Principle of Tag Clouds – “Where there’s tags, there’s a tag cloud” – says, this means there are quite a few tag clouds on the way in China.

Comment » | Tag Clouds

10 Best Practices For Displaying Tag Clouds

February 25th, 2007 — 12:00am

This is a short list of best practices for rendering and displaying tag clouds that I originally circulated on the IXDG mailing list, and am now posting in response to several requests. These best practices are not in order of priority – they’re simple enumerated.

  1. Use a sin­gle color for the tags in the ren­dered cloud: this will allow vis­i­tors to iden­tify finer dis­tinc­tions in the size dif­fer­ences. Employ more than one color with dis­cre­tion. If using more than one color, offer the capa­bil­ity to switch between sin­gle color and mul­ti­ple color views of the cloud.
  2. Use a sin­gle sans serif font fam­ily: this will improve the over­all read­abil­ity of the ren­dered cloud.
  3. If accu­rate com­par­i­son of rel­a­tive weight (see­ing the size dif­fer­ences amongst tags) is more impor­tant than over­all read­abil­ity, use a mono­space font.
  4. If com­pre­hen­sion of tags and under­stand­ing the mean­ing is more impor­tant, use a vari­ably spaced font that is easy to read.
  5. Use con­sis­tent and pro­por­tional spac­ing to sep­a­rate the tags in the ren­dered tag cloud. Pro­por­tional means that the spac­ing between tags varies based on their size; typ­i­cally more space is used for larger sizes. Con­sis­tent means that for each tag of a cer­tain size, the spac­ing remains the same. In html, spac­ing is often deter­mined by set­ting style para­me­ters like padding or mar­gins for the indi­vid­ual tags.
  6. Avoid sep­a­ra­tor char­ac­ters between tags: they can be con­fused for small tags.
  7. Care­fully con­sider ren­der­ing in flash, or another vector-based method, if your users will expe­ri­ence the cloud largely through older browsers / agents: the font ren­der­ing in older browsers is not always good or con­sis­tent, but it is impor­tant that the cloud offer text that is read­ily digestible by search and index­ing engines, both locally and publicly
  8. If ren­der­ing the cloud in html, set the font size of ren­dered tags using whole per­cent­ages, rather than pixel sizes or dec­i­mals: this gives the dis­play agent more free­dom to adjust its final rendering.
  9. Do not insert line breaks: this allows the ren­der­ing agent to adjust the place­ment of line breaks to suit the ren­der­ing context.
  10. Offer the abil­ity to change the order between at least two options — alpha­bet­i­cal, and one vari­able dimen­sion (over­all weight, fre­quency, recency, etc.)

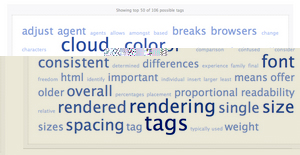
For fun, I’ve run these 10 best practices through Tagcrowd. The major concepts show up well – font, color, and size are prominent – but obviously the specifics of the things discussed remain opaque.

Best Practices For Display as a Text Cloud
best_practices_textcloud.jpg

Comment » | Tag Clouds

PEW Report Shows 28% Of Internet Users Have Tagged

February 1st, 2007 — 12:00am

The Pew Internet & American Life Project just released a report on tagging that finds 28% of internet users have tagged or categorized content online such as photos, news stories or blog posts. On a typical day online, 7% of internet users say they tag or categorize online content.

The authors note “This is the first time the Project has asked about tagging, so it is not clear exactly how fast the trend is growing.”
Wow – I’d say it’s growing extremely quickly. Though I am on record as a believer in the bright future of tag clouds, I admit I’m surprised by these results. The fact that 7% of internet users tag daily is what’s most significant: it’s an indication of very rapid adoption for the practice of tagging in many different contexts and many different kinds of audiences, given it’s brief history.

I’d guess this adoption rate compares to the rates of adoption for other new network-dependent or emergent architectures like P2P music sharing or on-line music buying.

You’re correct if you’re thinking there is a difference between tagging and tag clouds. And if you’ve read the report and the accompanying interview with Dr. Weinberger, you’ve likely realized that neither Dr. Weinberger’s interview nor the report specifically addresses tag cloud usage. But remember the First Principle of Tag Clouds: “Where there’s tags, there’s a tag cloud.” By definition, any item with an associated collection of tags has a tag cloud, regardless of whether that tag cloud is directly visible and actionable in the user experience. So that 7% of internet users who tag daily are by default creating and working with tag clouds daily.

It might be time for tag clouds to look into getting some sunglasses.

Comment » | Tag Clouds

Cartograms, Tag Clouds and Visualization

May 22nd, 2006 — 12:00am

I was enjoying some of the engaging cartograms available from Worldmapper, when I realized tag clouds might have some strong parallels with cartograms. After a quick substitution exercise, I’ve come to believe tag clouds could be to lists of metadata what cartograms are to maps; attempted solutions to similar visualization problems driven by common and historically consistent information needs.

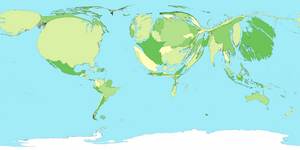
Here’s the train of thought behind the analogy. Cartograms are the distorted but captivating maps that change the familiar shapes of places on a map to visually show data about geographic locations. Cartograms change the way locations appear to make a point or communicate relative differences in the underlying data; for example, by making countries with higher GDP (gross domestic product) bigger, and those with lower GDP smaller. In the example below, Japan’s size is much larger than it’s geographic area, because it’s GDP is so high (it’s the dark green blob on the far right, much larger than China or India), while Africa is nearly invisible.

Gross Domestic Product
Tag clouds pursue the same goal: to enhance our understanding by communicating contextual meaning through changes in the way a set of things are visualized, relying additional dimensions of information to make context explicit. Where cartograms change geographic units, tag clouds change the display of a list of labels (the end point of a chain of linkages connecting concepts to focuses) to communicate the semantic importance or context of the underlying concepts shown in the list.

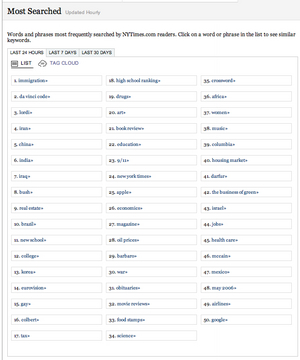
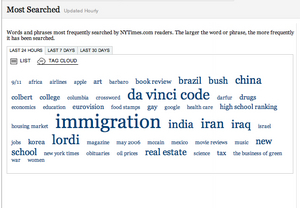
Visually, the relationship of clouds to lists is similar to that of maps and cartograms; compare these two renderings of the most popular search terms recorded by nytimes.com, one a simple list and the other a tag cloud.

List Rendering of Search Terms
Cloud Rendering of Search Terms
This explanation of cartograms from Cartogram Central a site supported by the U.S. Geological Survey and tional Center for Geographic Information and Analysis makes the parallels clearer, in greater detail.

“A cartogram is a type of graphic that depicts attributes of geographic objects as the object’s area. Because a cartogram does not depict geographic space, but rather changes the size of objects depending on a certain attribute, a cartogram is not a true map.

Cartograms vary on their degree in which geographic space is changed; some appear very similar to a map, however some look nothing like a map at all.”

Now for the cut and paste. Substitute ‘tag cloud’ for cartogram, ‘semantic’ for geographic, and ‘list’ in for map, and the same explanation reads:

“A tag cloud is a type of graphic that depicts attributes of semantic objects as the object’s area. Because a tag cloud does not depict semantic space, but rather changes the size of objects depending on a certain attribute, a tag cloud is not a true list. Tag Clouds vary on their degree in which semantic space is changed; some appear very similar to a list, however some look nothing like a list at all.”

This is a good match for the current understanding of tag clouds.

Diving in deeper, Cartogram Central offers an excerpt from Cartography: Thematic Map Design, that goes into more detail about the specific characteristics of cartograms.

Erwin Raisz called cartograms ‘diagrammatic maps.’ Today they might be called cartograms, value-by-area maps, anamorphated images or simply spatial transformations. Whatever their name, cartograms are unique representations of geographical space.

Examined more closely, the value-by-area mapping technique encodes the mapped data in a simple and efficient manner with no data generalization or loss of detail. Two forms, contiguous and non-contiguous, have become popular. Mapping requirements include the preservation of shape, orientation contiguity, and data that have suitable variation. Successful communication depends on how well the map reader recognizes the shapes of the internal enumeration units, the accuracy of estimating these areas, and effective legend design. Complex forms include the two-variable map. Cartogram construction may be by manual or computer means. In either method, a careful examination of the logic behind the use of the cartogram must first be undertaken.”Doing the same substitution exercise on this excerpt with the addition of ‘relevance’ for value, ‘size’ for area, and ‘term’ for shape, yields similar results:

“Erwin Raisz called tag clouds ‘diagrammatic lists.’ Today they might be called tag clouds, relevance-by-size lists, anamorphated images or simply spatial transformations. Whatever their name, tag clouds are unique representations of semantic space. Examined more closely, the relevance-by-size listing technique encodes the listed data in a simple and efficient manner with no data generalization or loss of detail. Two forms, contiguous and non-contiguous, have become popular. Listing requirements include the preservation of term, orientation, contiguity, and data that have suitable variation. Successful communication depends on how well the list reader recognizes the terms (of the internal enumeration units), the accuracy of estimating these sizes, and effective legend design. Complex forms include the two-variable list. Tag cloud construction may be by manual or computer means. In either method, a careful examination of the logic behind the use of the tag cloud must first be undertaken.”

The correspondence here is strong as well.

Stable Need
The fact that cartograms and tag clouds show close parallels means that while the tag cloud may be a new user interface element emerging for the Web (and major desktop applications like Outlook, in the case of Taglocity), tag clouds as a type of visualization have strong precedents in other much more mature user experience contexts, such as the display of multiple dimensions of information within geographic or geospatial frames of reference. Instances of strong correspondence of problem solving approach in both mature and emerging contexts could indicate simple application of parallel framing (from the mature context to the emerging context) as an untested conditional, until the true extent of divergence separating the two contexts is understood. This is very common new media.

Instead, in the case of tag clouds, I think it points at stable needs driving structurally similar solutions to the basic problem of how to visually communicate important relationships and additional dimensions of meaning under the limitations of inherent flatness.

The parallels between cartograms and tag clouds place the appearance of the tag cloud within the larger history of continuing exploration of new ways of visualizing information. In this view, tag clouds are a recent manifestation of the stable need to create strong and effective visual ways of conveying more than membership in a one-dimensional set (the list), or location and extent within a two-dimensional coordinate system (the map).

Comment » | Ideas, Tag Clouds

Back to top