Content management efforts are justly infamous for exceeding budgets and timelines, despite making considerable accomplishments. Exaggerated expectations for tool capabilities (vendors promise a world of automagic simplicity, but don’t believe the hype) and the potential value of cost and efficiency improvements from managing content creation and distribution play a substantial part in this. But unrealistic estimates of the scope of the content to be managed make a more important contribution to most cost and time overruns.
Scope in this sense is a combination of the quantity and the quality of content; smaller amounts of very complex content substantially increase the overall scope of needs a CM solution must manage effectively. By analogy, imagine building an assembly line for toy cars, then deciding it has to handle the assembly of just a few full size automobiles at the same time.
Early and inaccurate estimates of content scope have a cascading effect, decreasing the accuracy of budgets, timelines, and resource forecasts for all the activities that follow.
In a typical content management engagement, the activities affected include:
- taking a content inventory
- defining content models
- choosing a new content management system
- designing content structures, workflows, and metadata
- migrating content from one system to another
- refreshing and updating content
- establishing sound governance mechanisms
The Root of the Problem
Two misconceptions — and two common but unhealthy practices, discussed below — drive most content scope estimates. First: the scope of content is knowable in advance. Second, and more misleading, scope remains fixed once defined. Neither of these assumptions is valid: identifying the scope of content with accuracy is unlikely without a comprehensive audit, and content scope (initial, revised, actual) changes considerably over the course of the CM effort.
Together, these assumptions make it very difficult for program directors, project managers, and business sponsors to set accurate and detailed budget and timeline expectations. The uncertain or shifting scope of most CM efforts conflicts directly with business imperatives to carefully manage of IT capital investment and spending, a necessity in most funding processes, and especially at the enterprise level. Instead of estimating specific numbers long in advance of reality (as with the Iraq war budget), a better approach is to embrace fluidity, and plan to refine scope estimates at punctuated intervals, according to the natural cycle of content scope change.
Understanding the Content Scope Cycle
Content scope changes according to a predictable cycle that is largely independent of the specifics of a project, system, organizational setting, and scale. This cycle seems consistent at the level of local CM efforts for a single business unit or isolated process, and at the level of enterprise scale content management efforts. Understanding the cycle makes it possible to prepare for shifts in a qualitative sense, accounting for the kind of variation to expect while planning and setting expectations with stakeholders, solution users, sponsors, and consumers of the managed content.
The Content Scope Cycle
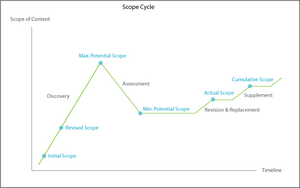
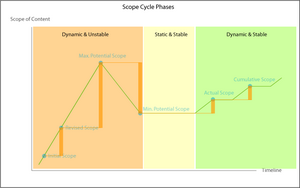
The high peak and elevated mountain valley shape in this illustration tell the story of scope changes through the course of most content management efforts. From the initial inaccurate estimate, scope climbs consistently and steeply during the discovery phase, peaking in potential after all discovery activities conclude. Scope then declines quickly, but not to the original level, as assessments cull unneeded content. Scope levels out during system / solution / infrastructure creation, and climbs modestly during revision and replacement activities. At this point, the actual scope is known. Measured increases driven by the incorporation of supplemental material then increase scope in stages.
Local and Enterprise Cycles
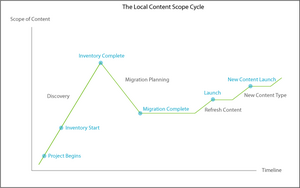
Applying the context-independent view of the cycle to a local level reveals a close match with the activities and milestones for a content management effort for a small body of content, a single business unit of a larger organization, or a self-contained business process.
Local Content Management Scope Cycle
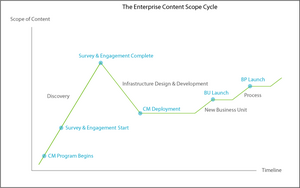
At the enterprise level, the cycle is the same. This illustration shows activities and milestones for a content management effort for a large and diverse body of content, multiple business units of a larger organization, or multiple and interconnected business process.
Enterprise Content Management Scope Cycle
Scope Cycle Changes
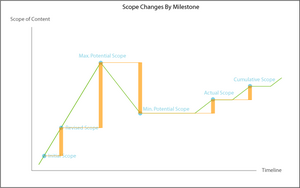
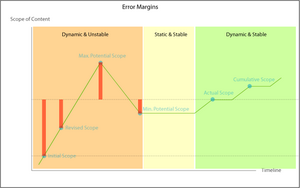
This graph shows the amount of scope change at each milestone, versus its predecessor. Looking at the changes for any patterns of clustering and frequency, it’s easy to see the cycle breaks down into three major phases: an initial period of dynamic instability, a static and stable phase, and a concluding (and ongoing, if the effort is successful) phase of dynamic stability.
Scope Cycle Phases
Where does the extra scope come from? In other words, what’s the source of the unexpected quantity and complexity of content behind the spikes and drops in expected scope in the first two phases? And why drives the shifts from one phase to another?
Bad CM Habits
Two common approaches account for a majority of the dramatic shifts in content scope. Most significantly, those people with immediate knowledge of the content quantity and complexity rarely have direct voice in setting the scope and timeline expectations.
Too often, stake holders with expertise in other areas (IT, enterprise architecture, application development) frame the problem and the solution far in advance. The content creators, publishers, distributors, and consumers are not involved early enough.
Secondly, those who frame the problem make assumptions about quantity and complexity that trend low. (This is in companion to the exaggeration of tool capabilities.) Each new business unit, content owner, and system administrator’s items included in the effort will increase the scope of the content in quantity, complexity, or both. Ongoing identification of new or unknown types of content, work flows, business rules, usage contexts, storage modes, applications, formats, syndication instances, systems, and repositories will continue to increase the scope until all relevant parties (creators, consumers, administrators, etc.) are engaged, and their needs and content collections fully understood.
The result is clear: a series of substantial scope errors of both under and over-estimatio, in comparison to the actual scope, concentrated in the first phase of the scope cycle.
Scope Errors
Smart Scoping
The scope cycle seems to be a fundamental pattern; likely an emergent aspect of the environments and systems underlying it, but that’s another discussion entirely. Failing to allow for the natural changes in scope over the course of a content management effort ties your success to inaccurate estimates, and this false expectations.
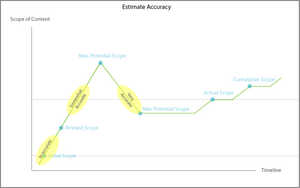
Smart scoping means allowing for and anticipating the inherent margins of error when setting expectations and making estimates. The most straightforward way to put this into practice and account for the likely margins of error is to adjust the timing of a scope estimate to the necessary level of accuracy.
Relative Scope Estimate Accuracy
Scoping and Budgeting
Estimation practices that respond to the content scope cycle can still satisfy business needs. At the enterprise CM level, IT spending plans and investment frameworks (often part of enterprise architecture planning processes) should allow for natural cycles by defining classes or kinds of estimates based on comparative degree of accuracy, and the estimator’s leeway for meeting or exceeding implied commitments. Enterprise frameworks will identify when more or less accurate estimates are needed to move through funding and approval gateways, based on each organization’s investment practices.
And at the local CM level, project planning and resource forecasting methods should allow for incremental allocation of resources to meet task and activity needs. Taking a content inventory is a substantial labor on its own, for example. The same is true of migrating a body of content from one or more sources to a new CM solution that incorporates changed content structures such as work flows and information architectures. The architectural, technical, and organizational capabilities and staff needed for inventorying and migrating content can often be met by relying on content owners and stake holders, or hiring contractors for short and medium-term assistance.
Parallels To CM Spending Patterns
The content scope cycle strongly parallels the spending patterns during CMS implementation James Robertson identified in June of 2005. I think the scope cycle correlates with the spending pattern James found, and it may even be a driving factor.
Scoping and Maturity
Unrealistic scope estimation that does not take the content scope cycle into account is typical of organizations undertaking a first content management effort. It is also common in organizations with content management experience, but low levels of content management maturity.
Two (informal) surveys of CMS practitioners spanning the past three years show the prevalence of scoping problems. In 2004, Victor Lombardi reported: “Of all tasks in a content management project, the creation, editing, and migration of content are probably the most frequently underestimated on the project plan.” [in Managing the Complexity of Content Management].
And two weeks ago, Rita Warren of CMSWire shared the results of a recent survey on challenges in content management (Things That Go Bump In Your CMS).
The top 5 challenges (most often ranked #1) were:
- Clarifying business goals
- Gaining and maintaining executive support
- Redesigning/optimizing business processes
- Gaining consensus among stakeholders
- Properly scoping the project
…“Properly scoping the project” was actually the most popular answer, showing up in the top 5 most often.
Accurate scoping is much easier for organizations with high levels of content management maturity. As the error margins inherent in early and inaccurate scope estimates demonstrate, there is considerable benefit in creating mechanisms and tools for effectively understanding the quantity and quality of content requiring management, as well as the larger business context, solution governance, and organizational culture concerns.


